
A practical guide for accountants and finance teams who want to spend less time fixing spreadsheets and more time analyzing the numbers.
Every accountant has inherited that spreadsheet. The one where changing a single cell breaks three tabs, where SUM formulas mysteriously double-count certain accounts, and where nobody can remember why row 47 is hardcoded to 127,500. Financial modeling doesn’t have to be this way. Whether you’re building a consolidated balance sheet for a multi-subsidiary manufacturing operation, comparing actuals against budget across departments, or creating a rolling forecast that updates with live NetSuite data, the same structural principles separate models that scale from models that collapse under their own complexity. After years of working with accounting teams ranging from startups to global enterprises, we’ve distilled these principles into five rules. Follow them, and you’ll build models that are easier to maintain, simpler to audit, and far less likely to produce that sinking feeling when the board asks a question you can’t answer.Rule 1: Separate Inputs from Calculations
The foundation of every maintainable financial model is a clean separation between what you’re asking for and how the answer is calculated. Consider a common scenario: You’re building a departmental P&L for Manufacturing, Inc., a company with three subsidiaries (Manufacturing, Inc. Consolidated at the top, with Manufacturing USA, Manufacturing Europe, and Manufacturing Asia underneath). Your CFO wants to see Engineering department expenses for FY 2024, Period 6, on a year-to-date basis.The wrong approach:
You embed these values directly into each formula:=FSN.GLAccountBalance("Manufacturing, Inc. USA", "FY 2024", 6, "YTD", "6100", 1, "", "", "Engineering", "", "")The right approach:
Create a parameter block at the top of your worksheet:| Cell | Label | Value |
| B2 | Subsidiary | Manufacturing USA |
| B3 | Fiscal Year | FY 2024 |
| B4 | Period | 6 |
| B5 | Period Range | YTD |
| B6 | Department | Engineering |
=FSN.GLAccountBalance($B$2, $B$3, $B$4, $B$5, $A10, 1, "", "", $B$6)Rule 2: Use Dynamic Cell References Consistently
Rule 1 establishes the principle; Rule 2 enforces the discipline. Every time you type a literal value inside a function argument, stop and ask yourself: “Will anyone ever want to change this?” If there is even a remote possibility, then use a cell reference instead. This approach applies beyond the obvious parameters. Consider these commonly overlooked candidates for cell references: Book Number: Most companies use Book 1 (Primary Accounting Book), but if you have secondary books for IFRS reporting or tax basis, parameterize it. Location and Class: For a manufacturing company with multiple plants, you might want to analyze the same P&L across different locations. Now switching from Denver to “Denver (Hierarchy)” (which includes Denver and all sub-locations like Denver: Warehouse, Denver: Production Floor) requires changing a single cell. The hidden benefit: Dynamic references make your model self-documenting. Anyone reviewing the spreadsheet can look at the parameter block and immediately understand what data they’re seeing. No more detective work trying to decode embedded assumptions.Rule 3: Keep Finsyte Functions Isolated
This rule trips up even experienced modelers: Never nest calculations inside a cell that contains a Finsyte data function. When you callFSN.GLAccountBalance(), that cell is doing something special—it’s reaching into NetSuite, retrieving live data, and enabling drill-down capabilities. If you right-click that cell, Finsyte lets you drill down by subsidiary, location, department, period, or all the way to individual transaction lines.
Wrap that function in additional calculations, and you break this capability.
Example 1: Allocation Percentages
Let’s say you want to allocate corporate overhead to departments based on headcount. Your Engineering department gets 35% of total overhead expenses. The wrong approach:=FSN.GLAccountBalance($B$2, $B$3, $B$4, $B$5, $A10) * 0.35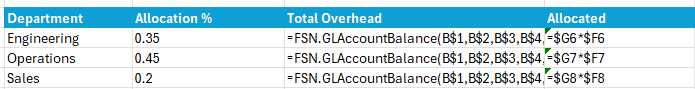 Column G contains your pure Finsyte functions—right-clickable, drillable, auditable. Column H handles the allocation math. When the CFO questions why Engineering’s overhead seems high, you right-click G6 to drill into the source data, then review the allocation percentage in F6 separately.
Example 2: Period-Over-Period Variance
You want to show the change in account balance from Period 5 (May) to Period 6 (June). The wrong approach:=FSN.GLAccountBalance(..., 6, "PTD", ...) - FSN.GLAccountBalance(..., 5, "PTD", ...)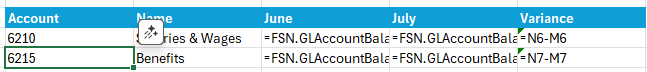 Now each period’s balance lives in its own cell. Right-click on a cell in Column N to drill into June’s transactions. Right-click Column M to drill into Period 5. The variance in Column O is a simple, auditable calculation.
A note on sign flipping: One common transformation—reversing signs for income statement presentation—is simple enough that it doesn’t require a helper column. You can place a negative sign directly in front of the function:
Now each period’s balance lives in its own cell. Right-click on a cell in Column N to drill into June’s transactions. Right-click Column M to drill into Period 5. The variance in Column O is a simple, auditable calculation.
A note on sign flipping: One common transformation—reversing signs for income statement presentation—is simple enough that it doesn’t require a helper column. You can place a negative sign directly in front of the function:
=-FSN.GLAccountBalance($B$2, $B$3, $B$4, $B$5, $A10)Rule 4: Use AGGREGATE or SUBTOTAL for Summations
Here’s a modeling pitfall that catches even seasoned accountants: using SUM in a hierarchical account structure leads to double-counting. Imagine your income statement has this structure:Revenue
├── Sales Revenue (4000)
├── Service Revenue (4100)
└── Other Revenue (4200)
Total Revenue [SUM of above]=SUM(D10:D25) to calculate a section total, and some of those rows contain subtotals themselves, you’ll count certain values twice.
The solution: Use AGGREGATE or SUBTOTAL functions, which can ignore other SUBTOTAL/AGGREGATE results in the range.
=AGGREGATE(9, 0, D10:D13)=SUBTOTAL(9, D10:D13)Rule 5: Build for Auditability and Drill-Down
The ultimate test of a financial model isn’t whether it produces the right number—it’s whether you can prove it produces the right number when someone questions it. Finsyte’s drill-down capability is your secret weapon here, but only if you structure your model to take advantage of it. Design for the “why is this number different?” question. Every month-end, someone will ask why an account balance doesn’t match their expectation. With a well-structured Finsyte model, the answer is a few clicks away:- Right-click the balance → Drill Down by Subsidiary → See how the consolidated number breaks down.
- Right-click a subsidiary’s balance → Drill Down by Location → See which plant is driving the variance.
- Right-click a location’s balance → Drill Down by Transaction Lines → See the actual journal entries, bill payments, invoices, etc.
- Click the link on the transaction to take you directly to the record in NetSuite.
Putting It All Together: A Practical Example
Let’s build a departmental expense analysis for Manufacturing, Inc. that follows all five rules. The requirement: Compare actual expenses to budget across all departments for the year in September of FY 2025, with the ability to drill into any variance.Step 1: Parameter Block (Rules 1 & 2)
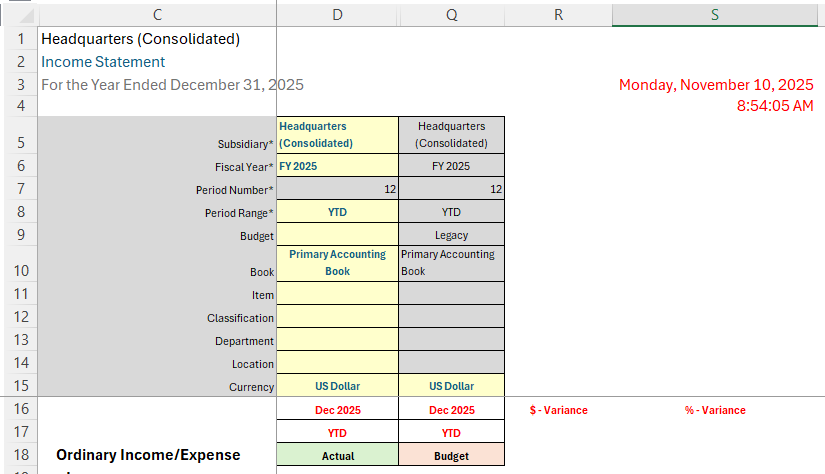
Step 2: Account Structure with Isolated Functions (Rule 3)
Columns D through Q contain pure Finsyte functions—right-clickable and drillable. Columns R and S calculate variance and variance percentage by referencing the data columns, keeping calculations separate from data retrieval.Step 3: Proper Totals (Rule 4)
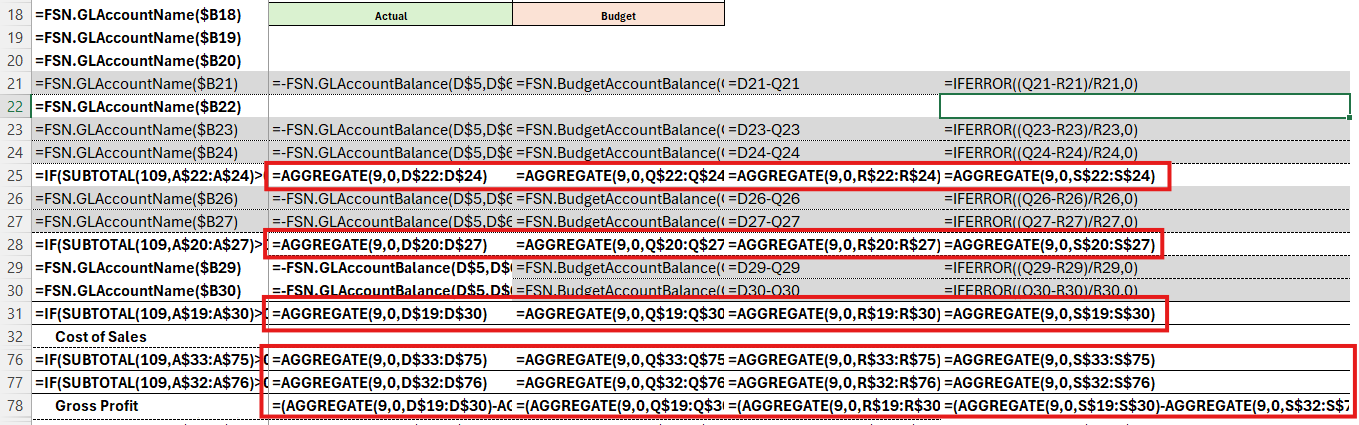 All totals and subtotals in the column use Aggregate, so native Excel grouping can be used and there is no risk of double-counting values.
Step 4: Document for Auditability (Rule 5)
Add a small documentation block with Report Generated date, Data Source, and Last Refreshed timestamp.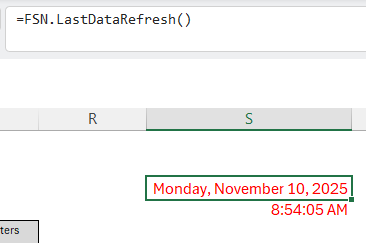 Use the
 FSN.LastDateRefresh() function to return a date/time result that you can format as a date or time.
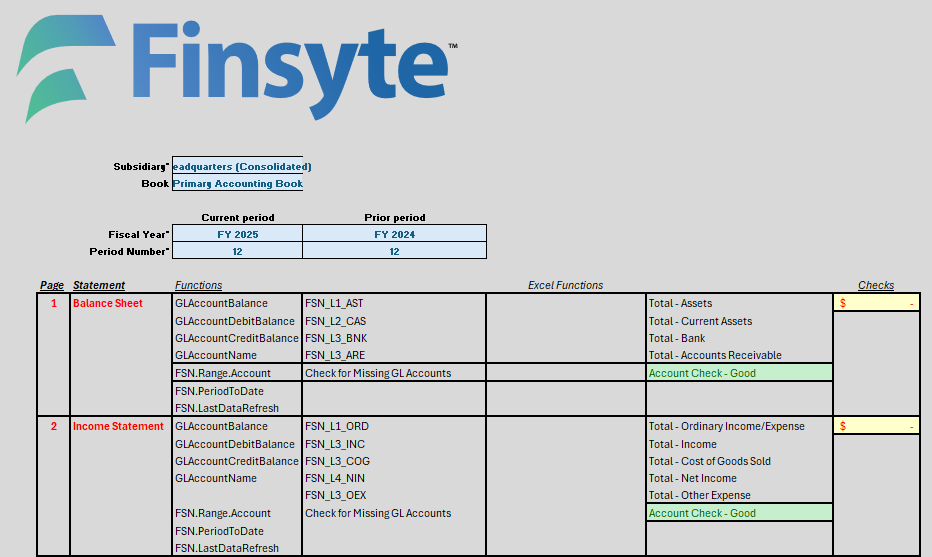
Add a Lead Sheet that contains all of the main drivers, as well as checks in your workbook (e.g., comparing your calculated Net Income value with the value from querying the special Finsyte Net Income account number)
The Payoff
Financial models built on the five rules above share the following common characteristics:- They survive personnel changes. When an FP&A employee leaves and another takes over, the newcomer will understand the model in minutes, not days.
- They scale with your business. Adding a fourth subsidiary? A new cost center? A secondary accounting book? Change parameters, not architecture.
- They build trust with stakeholders. When you can drill from a board presentation all the way to a specific journal entry in NetSuite, credibility follows.
- They reduce month-end stress. Close the books, update a few parameter cells, and your reports refresh. No formula surgery required.